OpenStreetMap User's Diaries
Empowering Communities Through Mapping: A Collaborative Journey in Tanzania
The SMCoSE YouthMappers Chapter, renowned as one of Tanzania’s largest mapping communities, hosted a transformative mapathon on April 14, 2024, at the esteemed Sokoine University of Agriculture. This event marked a pivotal moment of collaboration, extending invitations to other YouthMappers chapters in Morogoro, thus amplifying the inclusivity and impact of the initiative. Central to the mapatho
The SMCoSE YouthMappers Chapter, renowned as one of Tanzania’s largest mapping communities, hosted a transformative mapathon on April 14, 2024, at the esteemed Sokoine University of Agriculture. This event marked a pivotal moment of collaboration, extending invitations to other YouthMappers chapters in Morogoro, thus amplifying the inclusivity and impact of the initiative. Central to the mapathon’s objective was the concerted effort to contribute to Project #15530 within the HOT Tasking Manager, focusing on mapping cities across the Eastern and Southern Africa Region. By leveraging the power of open data, participants aimed to craft detailed base maps crucial for diverse applications, ranging from urban planning to efficient disaster response strategies.
Amidst an atmosphere described as “fantastic,” the event witnessed a remarkable accomplishment, the successful mapping of approximately 25,000 buildings. This feat not only underscores the collective dedication of the participants but also showcases the tangible outcomes of community-driven endeavors. Moreover, the mapathon served as a platform for new mappers to acquaint themselves with essential mapping tools such as ID Editors and JOSM, empowering them to contribute meaningfully to the OpenStreetMap ecosystem.
Special recognition is duly owed to the Open Mapping Hub Eastern and Southern Africa (OMHESA) for their unwavering support, notably through the prestigious Spatial People Award. This acknowledgment not only highlights the significance of collaborative partnerships but also accentuates the pivotal role of organizations in facilitating impactful mapathons and community initiatives. In essence, the event epitomized the ethos of collaboration, learning, and contribution inherent within the mapping community, further advancing the cause of open data dissemination and spatial awareness in the region.
In conclusion, the SMCoSE YouthMappers Chapter’s mapathon stands as a testament to the transformative potential of collective action in harnessing the power of mapping for societal benefit. It exemplifies how collaborative efforts can foster tangible change, driving forward the agenda of open data accessibility and spatial literacy within Tanzania and beyond.
“We don’t just build maps, we build Mappers”
The SMCoSE YouthMappers Chapter, renowned as one of Tanzania’s largest mapping communities, hosted a transformative mapathon on April 14, 2024, at the esteemed Sokoine University of Agriculture. This event marked a pivotal moment of collaboration, extending invitations to other YouthMappers chapters in Morogoro, thus amplifying the inclusivity and impact of the initiative. Central to the mapatho
The SMCoSE YouthMappers Chapter, renowned as one of Tanzania’s largest mapping communities, hosted a transformative mapathon on April 14, 2024, at the esteemed Sokoine University of Agriculture. This event marked a pivotal moment of collaboration, extending invitations to other YouthMappers chapters in Morogoro, thus amplifying the inclusivity and impact of the initiative. Central to the mapathon’s objective was the concerted effort to contribute to Project #15530 within the HOT Tasking Manager, focusing on mapping cities across the Eastern and Southern Africa Region. By leveraging the power of open data, participants aimed to craft detailed base maps crucial for diverse applications, ranging from urban planning to efficient disaster response strategies.
Amidst an atmosphere described as “fantastic,” the event witnessed a remarkable accomplishment, the successful mapping of approximately 25,000 buildings. This feat not only underscores the collective dedication of the participants but also showcases the tangible outcomes of community-driven endeavors. Moreover, the mapathon served as a platform for new mappers to acquaint themselves with essential mapping tools such as ID Editors and JOSM, empowering them to contribute meaningfully to the OpenStreetMap ecosystem.
Special recognition is duly owed to the Open Mapping Hub Eastern and Southern Africa (OMHESA) for their unwavering support, notably through the prestigious Spatial People Award. This acknowledgment not only highlights the significance of collaborative partnerships but also accentuates the pivotal role of organizations in facilitating impactful mapathons and community initiatives. In essence, the event epitomized the ethos of collaboration, learning, and contribution inherent within the mapping community, further advancing the cause of open data dissemination and spatial awareness in the region.
In conclusion, the SMCoSE YouthMappers Chapter’s mapathon stands as a testament to the transformative potential of collective action in harnessing the power of mapping for societal benefit. It exemplifies how collaborative efforts can foster tangible change, driving forward the agenda of open data accessibility and spatial literacy within Tanzania and beyond. “We don’t just build maps, we build Mappers”


 an outdoor mapping party in Medellín as part of #OpenDataDay.
 ►
►
 ►
► ►
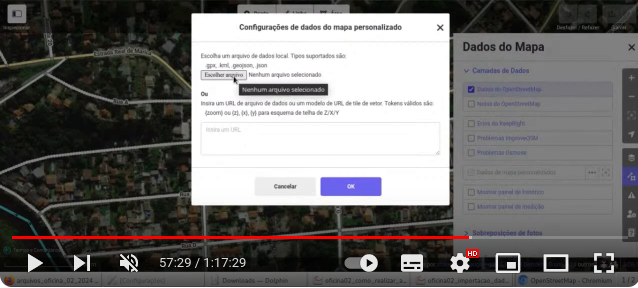
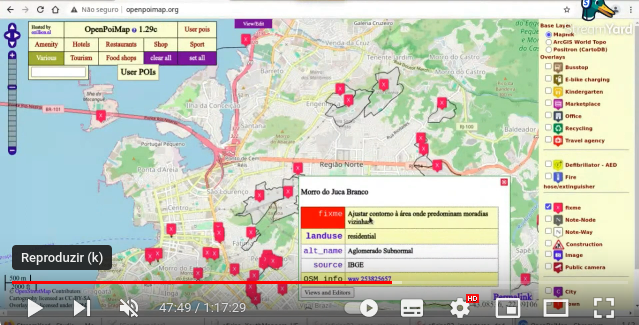
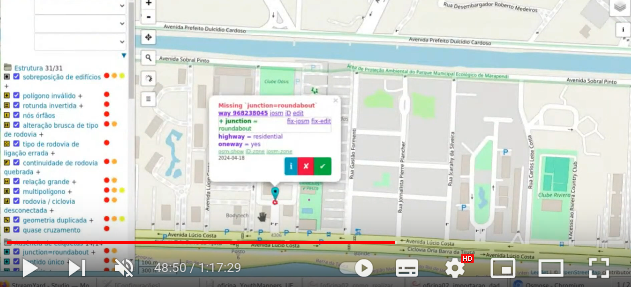
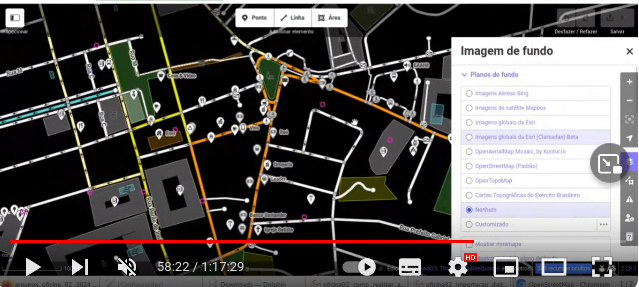
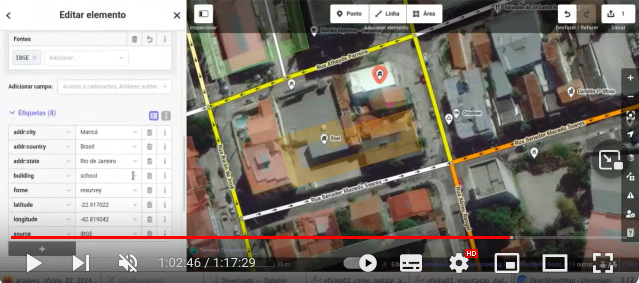
► Oficina de importação de POIs no OpenStreetMap, a partir de um arquivo de pontos – YouthMappers UFRJ


